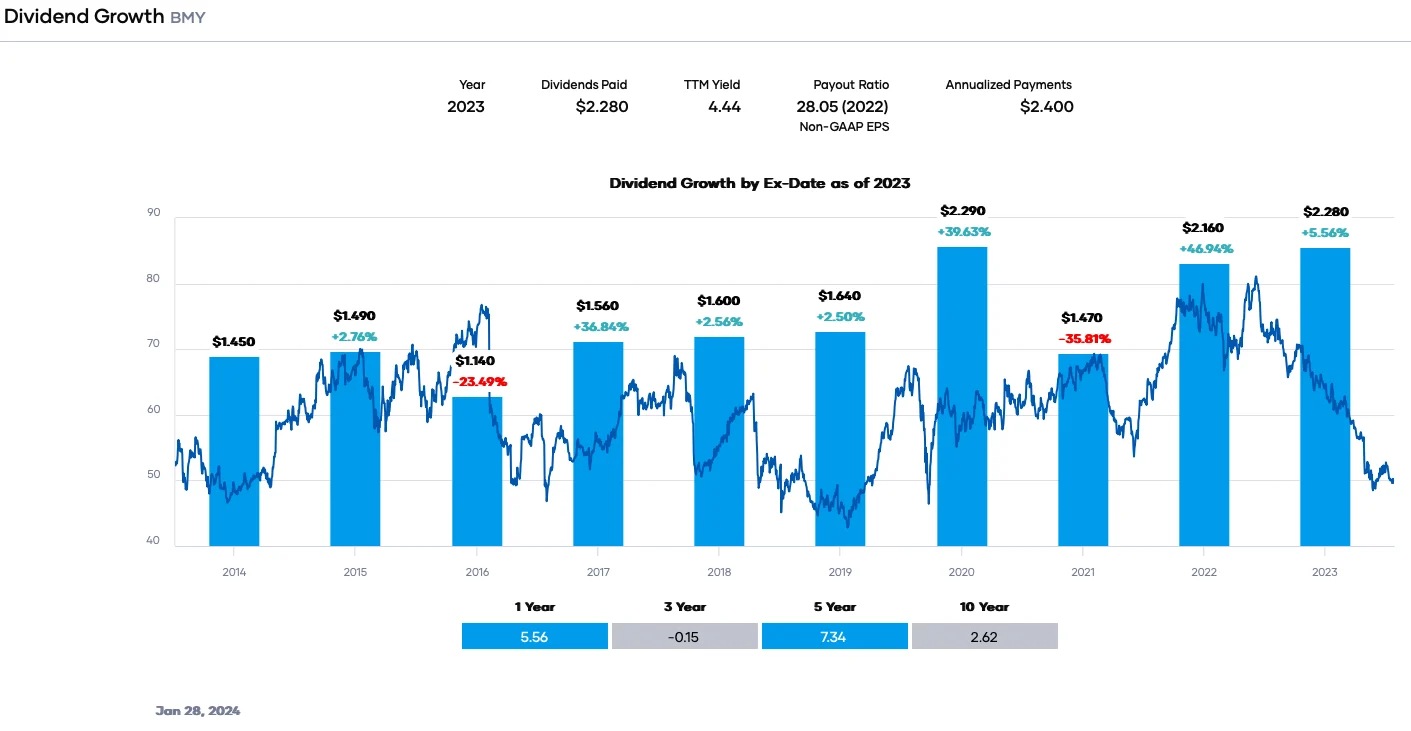
Bristol Myers Squibb (NYSE: BMY) stands as one of the pharmaceutical industry’s most iconic global giants. For income investors seeking steady cash distributions, reviewing the bmy dividend history provides essential insights into management’s financial discipline, shareholder priorities, and operational strength.
With uninterrupted quarterly dividend payments spanning nearly a century and a continuous dividend growth streak lasting over 17 years, BMY represents a core holding for income-focused portfolios.
Understanding the full trajectory of the bmy dividend history requires more than tracking yield alone. Analyzing payout safety, historical compound growth, debt levels, and commercial drug pipelines is critical before making an investment decision.
BMY Dividend Overview at a Glance
| Metric | Current Value |
| Ticker Symbol | NYSE: BMY |
| Current Annualized Dividend | $2.52 per share |
| Quarterly Payout | $0.63 per share |
| Current Dividend Yield | ~3.70% – 3.77% |
| Payout Ratio (EPS) | ~55% |
| Consecutive Years of Dividend Increases | 17 Years |
| Consecutive Years of Dividend Payments | 94 Years |
| Payment Frequency | Quarterly (Feb, May, Aug, Nov) |
Detailed Breakdown of the BMY Dividend History
Examining historical payouts highlights how Bristol Myers Squibb has consistently navigated market volatility, patent cliffs, and major pharmaceutical acquisitions while maintaining payout growth.
BMY Annual Dividend Payout History (2016 – 2026)
Below is an itemized breakdown of quarterly dividend declarations and annualized totals over the past decade:
| Year | Quarterly Dividend | Annualized Payout | Year-over-Year Increase |
| 2026 | $0.63 | $2.52 | +1.6% |
| 2025 | $0.62 | $2.48 | +3.3% |
| 2024 | $0.60 | $2.40 | +5.3% |
| 2023 | $0.57 | $2.28 | +5.6% |
| 2022 | $0.54 | $2.16 | +10.2% |
| 2021 | $0.49 | $1.96 | +8.9% |
| 2020 | $0.45 | $1.80 | +9.8% |
| 2019 | $0.41 | $1.64 | +2.5% |
| 2018 | $0.40 | $1.60 | +2.6% |
| 2017 | $0.39 | $1.56 | +2.6% |
| 2016 | $0.38 | $1.52 | +2.7% |
Analyzing the bmy dividend history reveals two distinct corporate phases over the last decade. Between 2016 and 2019, dividend growth remained modest at ~2.5% per year while the company conserved cash for research and pipeline expansion.
Following the landmark Celgene acquisition in late 2019, management accelerated dividend growth significantly. Shareholders benefited from high single-digit to double-digit annual increases between 2020 and 2022.
In recent years, dividend growth has returned to a more conservative ~1.6% to 3.3% annual pace. This measured approach allows the company to balance dividend growth with capital investments required to address upcoming loss of exclusivity on core legacy products.
BMY Dividend Growth Rates Across Key Timeframes
To evaluate how well a dividend stock preserves purchasing power against inflation, long-term compound annual growth rates (CAGRs) serve as an essential benchmark.
BMY Dividend Growth Rate Summary
- 1-Year Dividend Growth Rate: 2.03%
- 3-Year Dividend CAGR: 3.71%
- 5-Year Dividend CAGR: 5.51%
- 10-Year Dividend CAGR: 5.21%
The 5-year CAGR of 5.51% demonstrates that BMY has historically delivered dividend increases that outpace average long-term inflation.
Investors who purchased shares several years ago now enjoy an attractive yield on cost due to this compounding dividend trajectory reflected in the bmy dividend history.
Is the Bristol Myers Squibb Dividend Safe?
A high dividend yield is only valuable if it is backed by predictable cash flow. Evaluating dividend safety requires analyzing earnings coverage, free cash flow generation, and balance sheet strength.
1. Earnings Payout Ratio
Bristol Myers Squibb maintains a normalized earnings payout ratio of approximately 54.9%.
For major healthcare companies, a payout ratio below 60% is generally considered safe. It indicates that BMY retains nearly half of its profits to fund internal research and debt repayment.
2. Free Cash Flow (FCF) Coverage
Accounting earnings in pharma can fluctuate due to non-cash asset write-offs and acquisition amortization. Free cash flow provides a more accurate metric for dividend safety.
BMY consistently generates immense operating cash flow, often exceeding $12 billion annually. Quarterly cash dividends consume less than 50% of free cash flow, leaving substantial cash reserves for ongoing business commitments.
3. Debt Profile and Balance Sheet Health
Following its major acquisitions, BMY managed a higher debt load but has continuously reduced leverage through strong operational cash flow.
The combination of an investment-grade credit profile, steady cash generation, and a conservative payout ratio ensures the financial backing behind the bmy dividend history remains stable.
BMY Dividend History vs. Healthcare Sector Competitors
Comparing BMY’s dividend profile against major pharmaceutical peers helps put its income performance into perspective.
| Company Name | Ticker | Current Yield | 5-Yr Dividend CAGR | Payout Ratio | Growth Streak |
| Bristol Myers Squibb | BMY | ~3.7% – 3.8% | 5.5% | ~55% | 17 Years |
| Pfizer Inc. | PFE | ~6.0% | 2.4% | >100% (EPS volatile) | 15 Years |
| Merck & Co. | MRK | ~2.2% | 5.8% | ~60% | 13 Years |
| Johnson & Johnson | JNJ | ~1.9% | 5.6% | ~60% | 62 Years |
| AbbVie Inc. | ABBV | ~2.6% | 7.8% | ~85% | 52 Years |
Bristol Myers Squibb offers a unique middle ground for income seekers. It provides a significantly higher dividend yield than Johnson & Johnson or Merck while maintaining a much safer payout ratio than Pfizer.
This balanced yield-to-safety ratio makes the bmy dividend history an attractive case study for dividend growth strategies.
Key Drivers and Risks Influencing BMY Dividend Growth
While historical performance provides context, future dividend growth depends on company-specific growth drivers and broader industry challenges.
Primary Drivers Supporting Future Dividend Increases
- Growth Portfolio Adoption: Increasing revenue from newly approved drugs like Opdualag, Camzyos, and Sotyktu helps offset legacy product declines.
- Late-Stage Pipeline Potential: Active clinical trials across cell therapies, oncology, and immunology promise long-term revenue replenishment.
- Management Commitment: BMY’s executive leadership consistently ranks dividend growth among its highest capital allocation priorities.
Risks to Keep on Your Radar
- Patent Expirations: Major blockbusters like Eliquis and Opdivo face patent cliffs later in the decade, requiring rapid replacement revenues.
- Regulatory Price Pressures: Legislative provisions such as Medicare price negotiations could restrict future profit margins on key treatments.
- Pipeline Execution Risk: Delays or negative clinical trial outcomes can directly impair expected future cash flows.
Despite patent expiration headwinds, BMY’s disciplined payout ratio provides an operational safety margin that protects existing dividend payouts.
BMY Dividend Payment Schedule and Important Dates
To capture BMY dividend payouts efficiently, investors must understand the quarterly calendar and key distribution dates.
The Four Essential Dividend Dates
- Declaration Date: The Board of Directors officially announces the upcoming dividend rate and payment timeline.
- Ex-Dividend Date: The mandatory ownership cutoff date. You must purchase shares prior to this date to qualify for the dividend payout.
- Record Date: The date the company finalizes its list of eligible shareholders of record.
- Payment Date: The day dividend cash is deposited into investor accounts or automatically reinvested.
Standard BMY Quarterly Payment Schedule
- Q1 Payout: Ex-date in early January | Payment date in early February
- Q2 Payout: Ex-date in early April | Payment date in early May
- Q3 Payout: Ex-date in early July | Payment date in early August
- Q4 Payout: Ex-date in early October | Payment date in early November
Common Investor Mistakes When Analyzing BMY Dividends
Avoiding common analytical pitfalls can significantly improve long-term investment results when analyzing dividend stocks.
1. Overlooking Patent Expiration Timelines
Focusing exclusively on current dividend yield without accounting for product patent cliffs is a frequent mistake. Always monitor whether new commercial drug launches can adequately replace expiring revenue streams.
2. Ignoring Dividend Reinvestment (DRIP) Compounding
Taking quarterly dividend payments solely in cash reduces total return compounding potential over time. Enabling an automated Dividend Reinvestment Plan (DRIP) purchases fractional shares tax-efficiently without trading commission fees.
3. Attempting Dividend Capture Strategies
Buying stock immediately prior to the ex-dividend date to collect the payment before selling is rarely profitable. Stock prices automatically adjust downward on the ex-dividend date by the payout amount, creating tax friction without net economic gain.
How to Calculate Potential Returns From BMY Dividend History
To illustrate how holding BMY generates cash returns, consider a practical investment scenario.
If an investor purchases 400 shares of Bristol Myers Squibb at $50 per share ($20,000 total capital outlay):
- Annual Dividend Income: 400 shares × $2.52 = $1,008 per year
- Quarterly Cash Flow: $1,008 ÷ 4 = $252 per quarter
- Starting Yield on Cost: $1,008 ÷ $20,000 = 5.04% Yield on Cost
If dividend distributions grow at an average rate of 3% annually, the yearly payout increases to over $1,275 within eight years without deploying additional capital.
Conclusion: What the BMY Dividend History Means for Investors
Reviewing the overall bmy dividend history highlights Bristol Myers Squibb as a resilient, high-quality dividend payer suitable for conservative income strategies.
With nearly a century of continuous quarterly payments, 17 straight years of annual dividend increases, a ~3.7% yield, and a sustainable 55% payout ratio, BMY offers an optimal blend of immediate yield and income security.
While investors must track the company’s drug pipeline execution ahead of upcoming patent expirations, BMY’s formidable cash generation capabilities support the continued stability and growth of its payout. For investors building a diversified income portfolio, Bristol Myers Squibb remains a reliable contender.